Overview
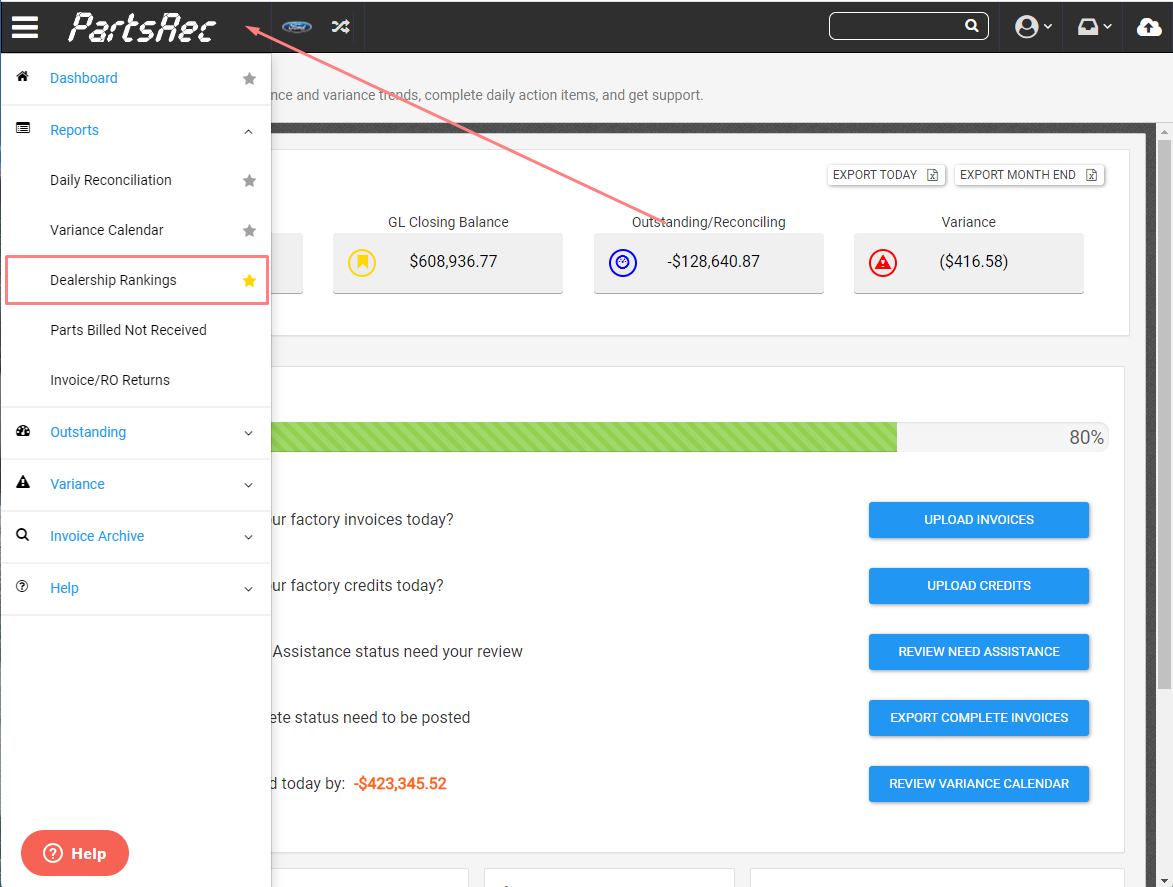
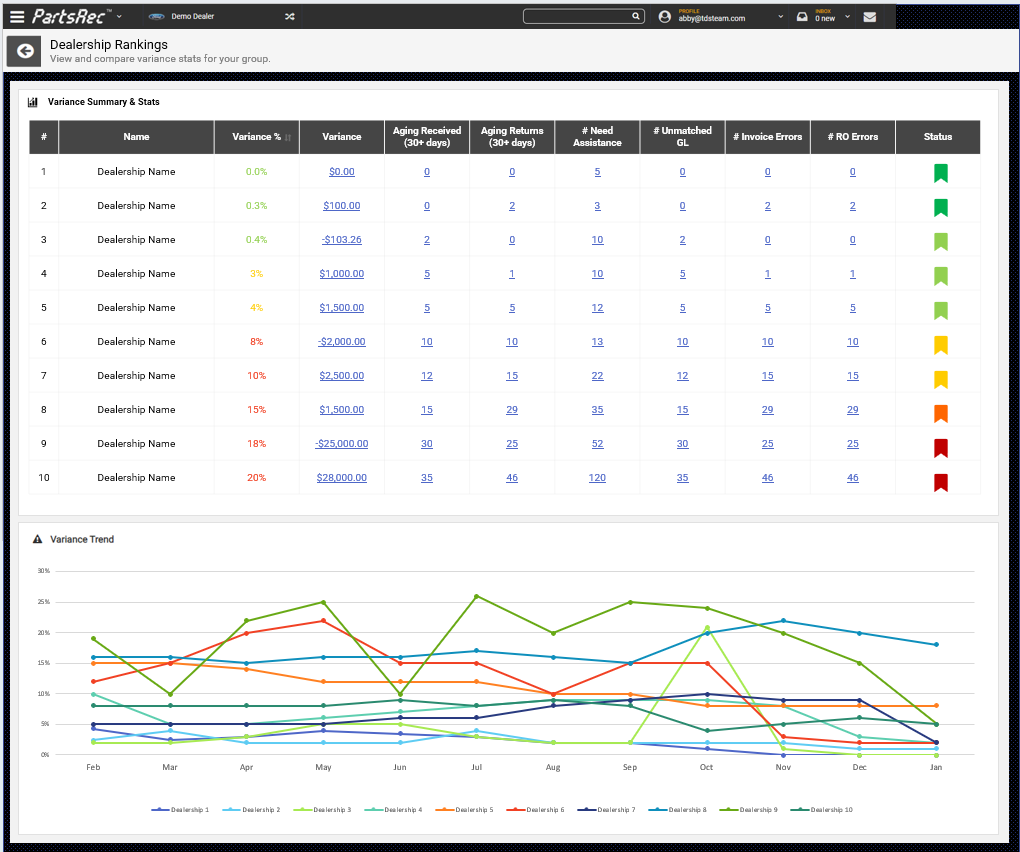
Under the reports section from your PartsRec Menu, you can view a Dealership Rankings report that will rank your dealerships by variance % and display additional variance stats and trends. You can star this page to make it your home/favorite page.
Variance Summary and Stats
- All stores that you are associated to will be displayed, ranked by variance %.
- 0-3% = green, 3-5% = yellow, and over 5% = red.
- Fields are clickable to drill down into a specific store's variance metrics.
- Click column headers to re-sort rankings report by that metric.
- Top 10 stores are displayed on page 1. If you have more than 10 stores, click "next" page to view.
Variance Trend
- A rolling 12 month variance trend will be shown for all stores (depending on data start date).
- You can zoom in with your mouse-wheel (desktop) or pinch-zoom (mobile), or
Hold the Shift key and select an area. - Once zoomed, you can pan right or left on the chart area by clicking and dragging your mouse.